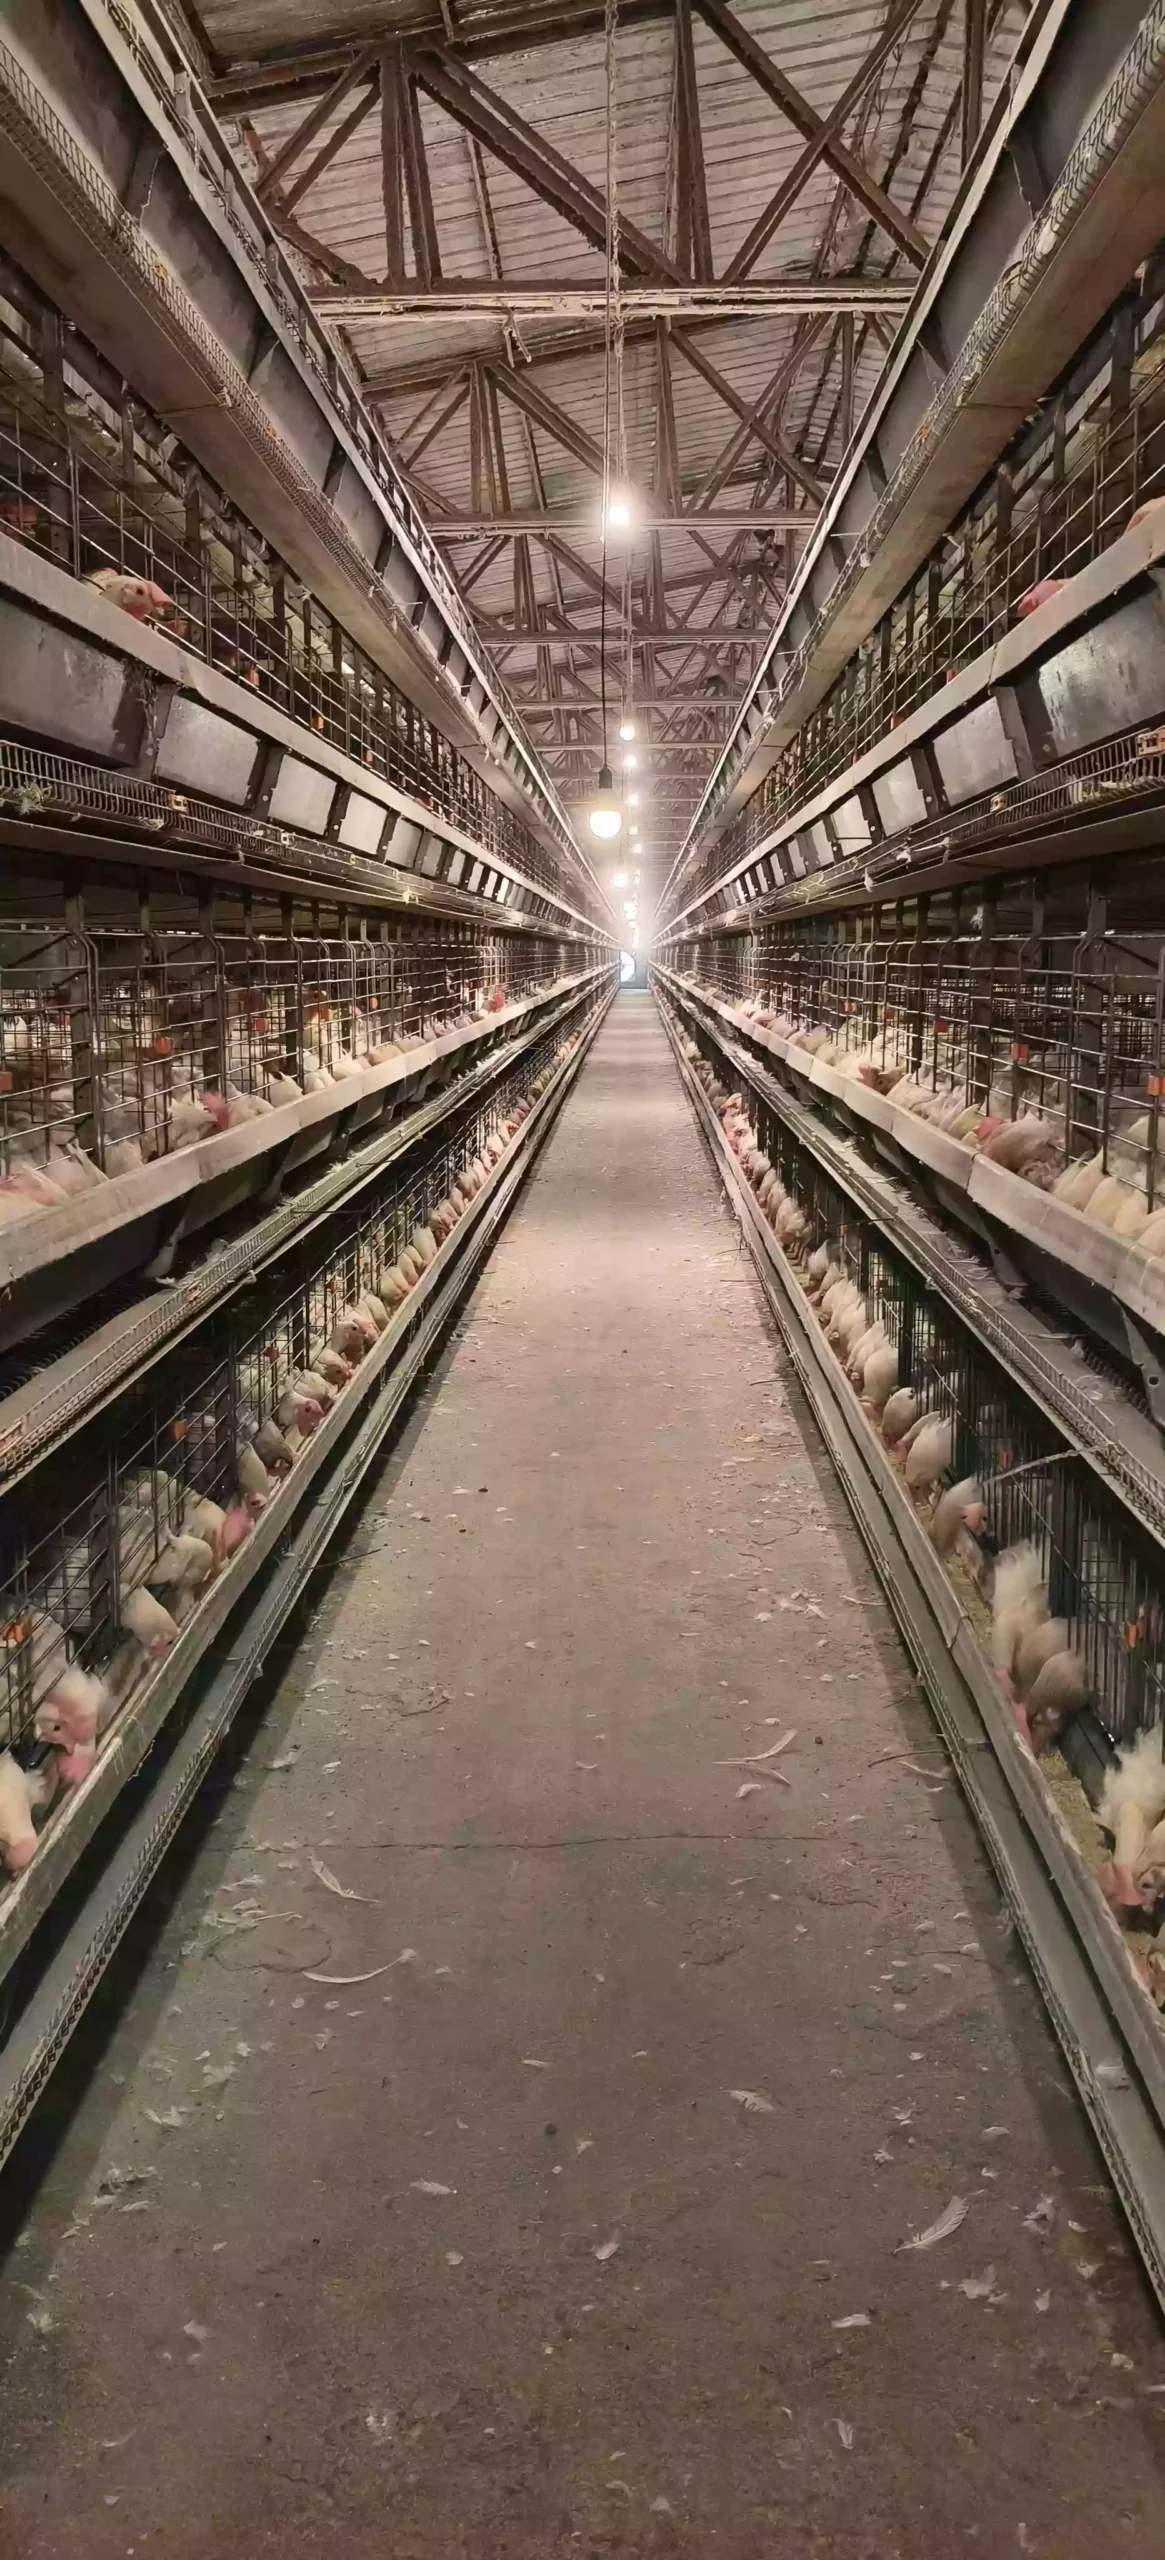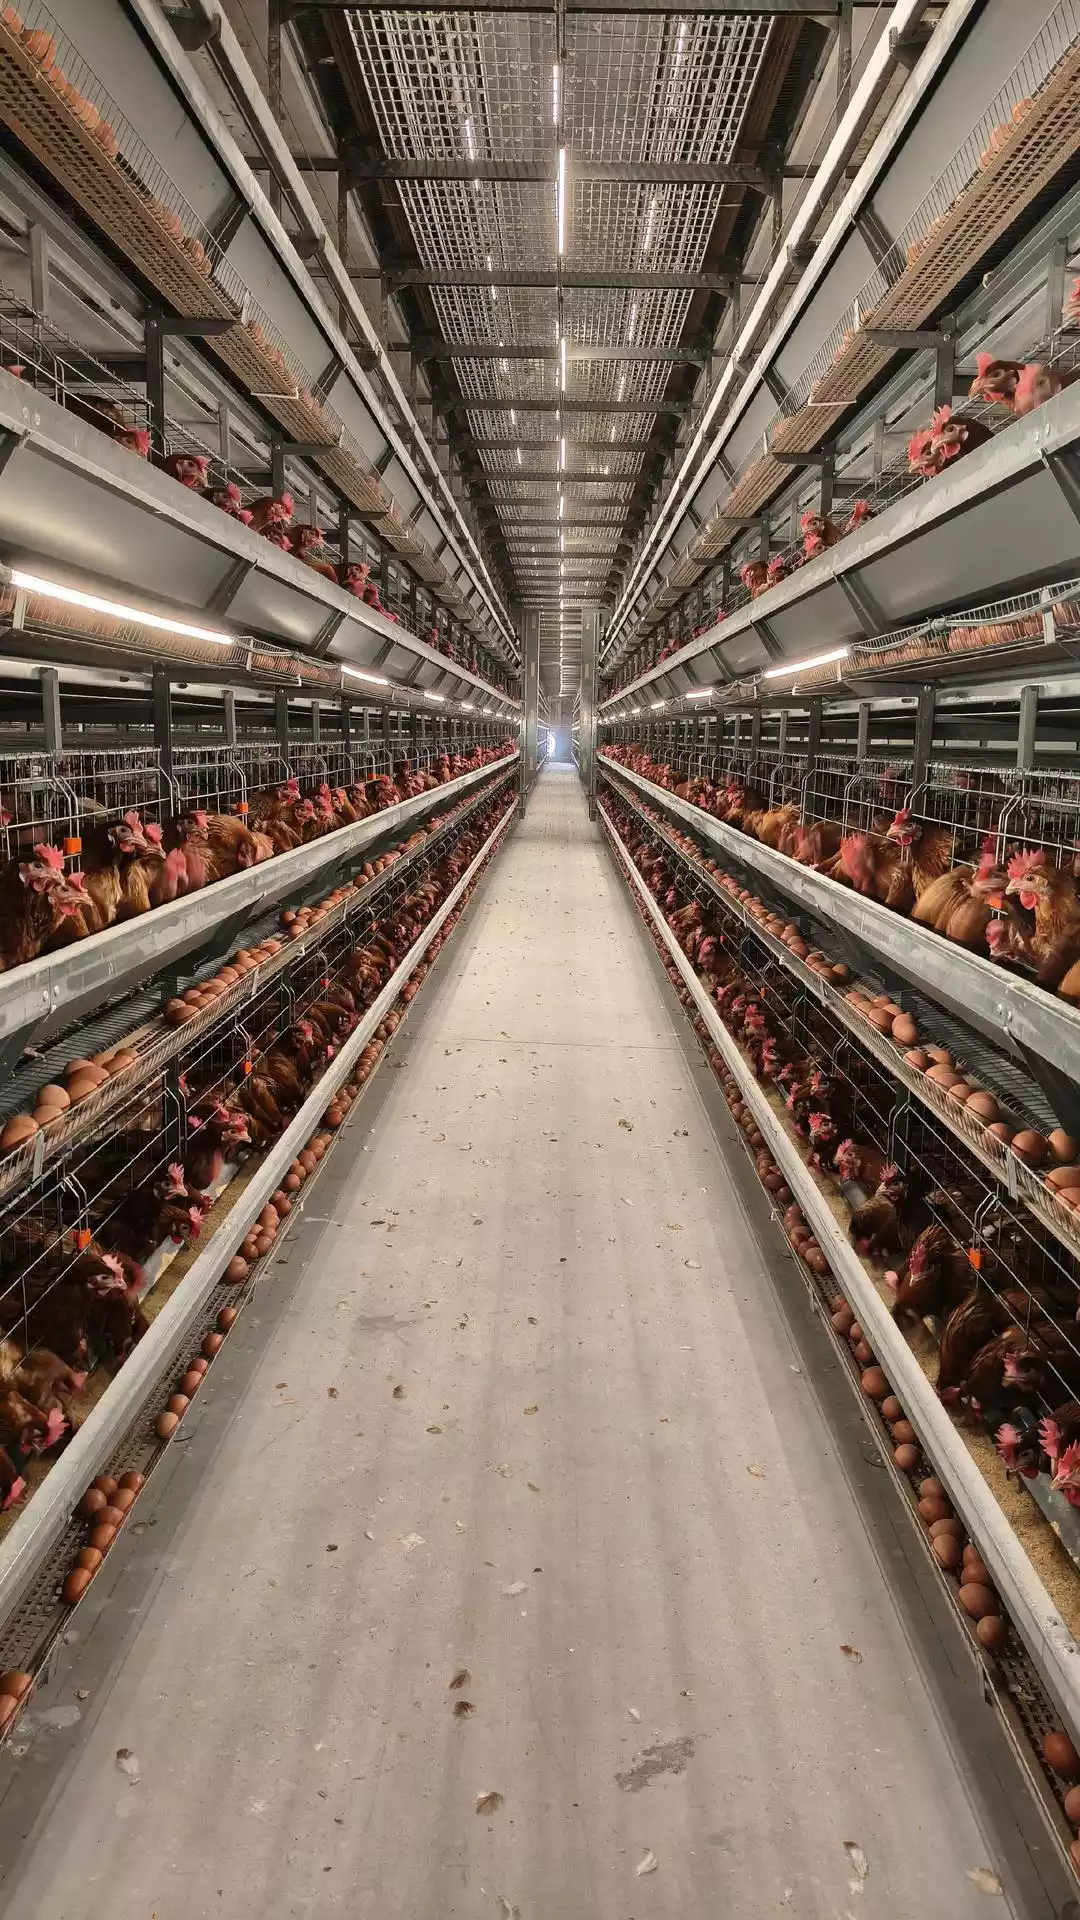

How to run a successful poultry business for 100,000-Bird Layer Farm

Discover the essential strategies to run a successful poultry business with a 100,000-bird layer farm in 2025.Why is the profit per layer as low as only ¥1.76 in the Chinese market this year ? You might say, “How can it be so low?” Yet, many people would actually consider it a blessing just to break even without losses this year.
Profitability Analysis Report for a 100,000-Bird Layer Farm in 2025
I. Core Production Performance & Market Assumptions
Farm Scale
- Breed & Quantity: Hy-Line laying hens, 100,000 birds
- Breeding Cycle: 510 days (Peak laying period starts on Jan 1, 2025; Culling on Dec 30, 2025)
Table 1: Core Production Parameters & Background Data (360 eggs/case,22.5 kg)
| Month | Lay Rate | Daily Output (cases) | Egg Price (RMB/case) | Feed Cost (RMB/ton) |
|---|---|---|---|---|
| Jan | 95% | 264 | 179 | 2,350 |
| Feb | 95% | 264 | 139 | 2,350 |
| Mar | 95% | 264 | 152 | 2,350 |
| Apr | 95% | 264 | 154 | 2,500 |
| May | 92% | 256 | 139 | 2,500 |
| Jun | 92% | 256 | 140 | 2,500 |
| Jul | 92% | 256 | 150 | 2,550 |
| Aug | 90% | 250 | 180 | 2,550 |
| Sep | 90% | 250 | 200 | 2,550 |
| Oct | 90% | 250 | 180 | 2,550 |
| Nov | 88% | 244 | 170 | 2,500 |
| Dec | 88% | 244 | 170 | 2,500 |
Table 2: Daily Cost Breakdown (Dynamic Calculation Reference)
| Cost Item | Calculation Method | Amount (RMB/day) | Notes |
|---|---|---|---|
| Feed Cost | Feed price/ton × 12 tons | Variable | Changes monthly per Table 1 |
| Packaging Cost | 7 RMB/case × Daily output | Variable | Changes with daily output |
| Egg Collection | 500 | ||
| Mortality Cost | 640 | ||
| Healthcare | 1,000 | ||
| Labor & Utilities | 700 | ||
| Manure Handling | 333 | ||
| Total Daily Cost | Variable | Mainly affected by feed price & output |
II. Profit Calculation Logic & Results
Table 3: Monthly Income & Profit Calculation Summary (Updated)
| Month | Monthly Income (RMB) | Monthly Expenses (RMB) | Monthly Profit (RMB) |
|---|---|---|---|
| Jan | 179 × 264 × 30 = 1,417,680 | 996,630 | 421,050 |
| Feb | 139 × 264 × 30 = 1,100,880 | 993,690 | 107,190 |
| Mar | 152 × 264 × 30 = 1,203,840 | 993,690 | 210,150 |
| Apr | 154 × 264 × 30 = 1,219,680 | 1,050,630 | 169,050 |
| May | 139 × 256 × 30 = 1,067,520 | 1,048,950 | 18,570 |
| Jun | 140 × 256 × 30 = 1,075,200 | 1,048,950 | 26,250 |
| Jul | 150 × 256 × 30 = 1,152,000 | 1,066,950 | 85,050 |
| Aug | 180 × 250 × 30 = 1,350,000 | 1,065,690 | 284,310 |
| Sep | 200 × 250 × 30 = 1,500,000 | 1,065,690 | 434,310 |
| Oct | 180 × 250 × 30 = 1,350,000 | 1,065,690 | 284,310 |
| Nov | 170 × 244 × 30 = 1,244,400 | 1,046,430 | 197,970 |
| Dec | 170 × 244 × 30 = 1,244,400 | 1,046,430 | 197,970 |
| Total | 14,925,600 | 12,489,420 | 2,436,180 |
Table 4: Spent Hen Revenue & Initial Costs Summary
| Item | Calculation Method | Amount (RMB) |
|---|---|---|
| Spent Hen Revenue | ||
| Number Sold | 100,000 × (1 – 8%) = 92,000 birds | |
| Avg Weight | 4 jin/bird | |
| Price | 5 RMB/jin | |
| Total Revenue | 92,000 × 4 × 5 | 1,840,000 |
| Initial Investment | ||
| Pullet Cost | 100,000 × 18 RMB/bird | 1,800,000 |
| Initial Feed Cost | 100,000 × 18 RMB/bird | 1,800,000 |
| Initial Labor & Healthcare | 100,000 × 5 RMB/bird | 500,000 |
| Total Initial Cost | 4,100,000 |
Table 5: Overall Profit & Loss Calculation
| Indicator | Calculation Method | Amount (RMB) |
|---|---|---|
| Gross Profit from Eggs | 2,436,180 | |
| Spent Hen Revenue | 1,840,000 | |
| Total Revenue | 2,436,180 + 1,840,000 | 4,276,180 |
| Total Initial Cost | 4,100,000 | |
| Net Profit | 4,276,180 – 4,100,000 | 176,180 |
| Profit Per Bird | 176,180 ÷ 100,000 | ≈1.76 RMB |
III. Key Profit Conditions & Risk Warnings
1. Production Performance Requirements
- Lay Rate: Peak rate of 95% must be maintained for over 4 months; annual average should remain above 90% for 10 months.
- Health Management: No major disease outbreaks; only basic healthcare allowed without additional medication costs.
2. Risk Warnings
- Excluded Costs: This calculation excludes fixed asset depreciation and capital interest; actual profit may be lower.
- Market Risks: Egg price fluctuations pose the biggest risk. 200 RMB/case is the break-even point; higher prices or lower costs are needed for substantial profit.
3. Conclusion
Under the given assumptions, this project can achieve marginal profitability. However, success highly depends on excellent farming management and stable market prices.
This data only reflects the situation in China. Egg prices in other countries and regions may vary significantly. After checking the prices elsewhere, I finally understand why it’s been so hard to make a profit this year.
Eggs (regular) (12), Markets(https://www.numbeo.com/cost-of-living/country_price_rankings?itemId=11)
| Number | Country | Price (USD) | Number | 国家/地区 | Country |
|---|---|---|---|---|---|
| 1 | Switzerland | 7.57 | 64 | Venezuela | 2.55 |
| 2 | Iceland | 6.52 | 65 | Oman | 2.54 |
| 3 | New Zealand | 6.42 | 66 | Moldova | 2.53 |
| 4 | Denmark | 5.10 | 67 | Mexico | 2.45 |
| 5 | Luxembourg | 5.07 | 68 | Ghana | 2.41 |
| 6 | Netherlands | 4.91 | 69 | Georgia | 2.39 |
| 7 | Austria | 4.85 | 70 | Guatemala | 2.35 |
| 8 | Norway | 4.57 | 71 | Armenia | 2.33 |
| 9 | Australia | 4.53 | 72 | South Africa | 2.31 |
| 10 | Greece | 4.52 | 73 | Mozambique | 2.30 |
| 11 | Cyprus | 4.44 | 74 | Ethiopia | 2.28 |
| 12 | Sweden | 4.44 | 75 | Ivory Coast | 2.27 |
| 13 | France | 4.41 | 76 | North Macedonia | 2.24 |
| 14 | Uruguay | 4.40 | 77 | Mauritius | 2.23 |
| 15 | United States | 4.38 | 78 | Turkey | 2.19 |
| 16 | Israel | 4.37 | 79 | Botswana | 2.18 |
| 17 | Trinidad And Tobago | 4.33 | 80 | Colombia | 2.18 |
| 18 | Ireland | 4.30 | 81 | Japan | 2.18 |
| 19 | Italy | 4.10 | 82 | Tanzania | 2.17 |
| 20 | Belgium | 4.07 | 83 | Ecuador | 2.17 |
| 21 | United Kingdom | 3.99 | 84 | Jordan | 2.17 |
| 22 | Germany | 3.90 | 85 | Thailand | 2.13 |
| 23 | Slovakia | 3.87 | 86 | Nicaragua | 2.12 |
| 24 | Slovenia | 3.84 | 87 | Brazil | 2.12 |
| 25 | Croatia | 3.82 | 88 | Zimbabwe | 2.10 |
| 26 | Malta | 3.81 | 89 | Philippines | 2.10 |
| 27 | Albania | 3.81 | 90 | Sri Lanka | 2.07 |
| 28 | Papua New Guinea | 3.79 | 91 | Kuwait | 2.06 |
| 29 | Chile | 3.55 | 92 | Madagascar | 2.05 |
| 30 | Hong Kong (China) | 3.52 | 93 | Cameroon | 2.05 |
| 31 | Bulgaria | 3.51 | 94 | Mongolia | 2.03 |
| 32 | Canada | 3.50 | 95 | Malaysia | 2.02 |
| 33 | Finland | 3.47 | 96 | Bolivia | 2.00 |
| 34 | Poland | 3.46 | 97 | Morocco | 1.97 |
| 35 | Jamaica | 3.42 | 98 | Nigeria | 1.91 |
| 36 | Costa Rica | 3.39 | 99 | Uganda | 1.88 |
| 37 | Czech Republic | 3.36 | 100 | Paraguay | 1.85 |
| 38 | Cuba | 3.34 | 101 | Algeria | 1.81 |
| 39 | Romania | 3.29 | 102 | Myanmar | 1.80 |
| 40 | Singapore | 3.25 | 103 | Tajikistan | 1.77 |
| 41 | Montenegro | 3.25 | 104 | Ukraine | 1.76 |
| 42 | Portugal | 3.22 | 105 | Iraq | 1.75 |
| 43 | Palestine | 3.15 | 106 | Syria | 1.73 |
| 44 | United Arab Emirates | 3.13 | 107 | Russia | 1.70 |
| 45 | Spain | 3.11 | 108 | Kyrgyzstan | 1.66 |
| 46 | Latvia | 3.10 | 109 | Kosovo (Disputed Territory) | 1.65 |
| 47 | Lithuania | 3.09 | 110 | Tunisia | 1.64 |
| 48 | Fiji | 3.02 | 111 | Dominican Republic | 1.63 |
| 49 | Hungary | 3.00 | 112 | Rwanda | 1.62 |
| 50 | Estonia | 2.93 | 113 | China | 1.58 |
| 51 | South Korea | 2.89 | 114 | Nepal | 1.58 |
| 52 | Bosnia And Herzegovina | 2.88 | 115 | Indonesia | 1.57 |
| 53 | Namibia | 2.85 | 116 | Kenya | 1.56 |
| 54 | Taiwan | 2.84 | 117 | Uzbekistan | 1.56 |
| 55 | Argentina | 2.74 | 118 | Kazakhstan | 1.54 |
| 56 | El Salvador | 2.69 | 119 | Vietnam | 1.46 |
| 57 | Qatar | 2.67 | 120 | Egypt | 1.46 |
| 58 | Serbia | 2.67 | 121 | Azerbaijan | 1.44 |
| 59 | Lebanon | 2.67 | 122 | Libya | 1.30 |
| 60 | Peru | 2.66 | 123 | Belarus | 1.30 |
| 61 | Bahrain | 2.62 | 124 | Pakistan | 1.18 |
| 62 | Panama | 2.61 | 125 | Bangladesh | 1.16 |
| 63 | Saudi Arabia | 2.55 | 126 | Iran | 1.12 |
| 127 | India | 0.94 |